
The archaeology tax you pay every day
Most of the time you spend on unfamiliar code isn't writing it — it's reconstructing how it fits together. That tax gets paid on every ticket, in every repo, by every new hire.
- “Which endpoint does this button actually hit?” — 40 minutes of grep
- You change a service and something three tiers away breaks
- The one person who knows this module is on holiday
- Onboarding to a new repo takes weeks of shoulder-tapping
- Your AI assistant invents an architecture that doesn't exist
- “Is this function even called anywhere?”
CLICK-TO-TABLE TRACES
Follow a click all the way down
ClarifyDoc links the chain the runtime would take: a component emit resolves to the parent handler, the handler to its service, the service to the HTTP call, the route to its controller, dependency injection to the concrete class, and the ORM query to the entity it mutates.
- Component
emit('save')→ parent@savehandler - Frontend service →
POST /api/…→ backend route - Interface + DI resolved to the concrete implementation
- Every hop links to
file:line, every link carries a confidence level
<AvatarField> emit('save')ProfileForm.onSave()PUT /api/users/{id}IUserService → UserServiceUsers — UPDATE display_name, avatarBEFORE YOU REFACTOR
Know the blast radius first
Every file and class carries a change-impact set — who depends on it, and how tightly. Links are scored by when they run: tight (on mount), medium (on state change), loose (on user action). You see what a change touches before you make it, not in the incident channel after.
- Per-file and per-class impact sets
- Proximity scoring so you triage the tight coupling first
- Spot god-nodes and surprising connections
UsersController.csAuthMiddleware.csProfileForm.vueuserService.tsAdminUsers.tsx+ 7 moreFOR AI-ASSISTED DEVELOPMENT
Give your agent the real map, not guesses
ClarifyDoc serves its analysis over MCP. In VS Code, Copilot’s agent mode picks it up with no
setup; Claude Code, Cursor, Windsurf, Codex, Gemini CLI and Claude Desktop take one command. Your agent asks which routes exist,
who calls a function, what a diff breaks and which table an endpoint writes — and gets answers
with path:line references instead of inventing an architecture from a few open files.
- Tools for search, routes, contracts, screens, traces, blast radius, data model, data flows, health and diff impact
- Deterministic — the same commit gives the same answers
- Cross-tier chains an LLM can’t infer from one open file
- Copy Impact for Agent hands it what your diff reaches, function by function
- Before it edits: what a proposed change breaks, the tests to run as the runner’s own command, and the files usually changed with it
- Hooks, skills and an
AGENTS.mdsection, set up from the same VS Code command: before a grep the agent hears what the map knows, after an edit who depends on the file — and a hook never blocks it
All 23 tools, how to connect them, and what they save in tokens →
# the chain your agent gets back, with file and line
Screen  Settings         Settings.js
  ↳ Auth.save → PUT /user   agent.js
     ↳ updateUser()        auth.service.ts:151
        ↳ User  UPDATE      auth.service.ts:159
CAUGHT IN THE EDITOR
Problems you’d otherwise find in review — or in production
The analysis feeds VS Code’s own surfaces: Problems, CodeLens, hovers, Go to Definition and Source Control. These are the jobs it does there.
Calls to endpoints that no longer exist
A frontend call that no backend route answers shows up in Problems at the call, with a quick fix to the route that does exist. A body missing a required field, or a response read for a field the route never returns, is flagged the same way.
Review what your agent changed
The Impact view turns your uncommitted diff into the routes, screens, tables and tests it reaches, down to the function, and marks the callers the editor already reports errors at.
What a branch does to the API
Compare API Surface lists what the branch changes in routes, guards and bodies — a route removed or moved, a guard lost, a call that no longer reaches its route — breaking changes first.
From a call to its route, and back
F12 on an API call’s URL opens the backend route that serves it, in whichever language it lives. Find References on a route lists the calls that reach it; a CodeLens draws it as a sequence diagram.
The open file, as a graph
Neighbourhood docks a graph of the open file beside your code — its functions, what calls in and out, the routes it serves or calls — and follows the cursor. Show in a Graph does the same for any selection.
Untested lines and stale docs
Lines no test runs are marked from your coverage report. Markdown that names a path, route or member the code no longer has is flagged, with a quick fix to a renamed path’s new name.
Tests to run, as a command
Tests show in CodeLens beside the code they cover, and the Impact view lists the ones a change reaches. Your agent and clarifydoc impact get them as the runner’s own command — pytest node ids, go test -run, dotnet test --filter, Maven, Gradle, Vitest or Jest — in twelve languages.
A function as a flowchart
Click a complexity score and the function is drawn as a flowchart that follows your cursor and redraws as you type — exact for the tree-sitter languages, approximate for a dozen more. Open it in Mermaid Live or save it.
An architecture diagram, in one command
Create Architecture Diagram draws the system from the analysis — no model, no prompt — so the same code draws the same diagram. Save it as Mermaid, Markdown or SVG and commit it.
ON EVERY PULL REQUEST
A gate that fails only on what the change introduces
The GitHub Action analyzes the base commit once and caches it; each push reparses only what the pull request changed. One comment, edited on every push, lists the API changes and the findings the PR adds; the SARIF goes to code scanning. The check fails only on what you name — inherited debt never turns a PR red.
fail-on-api: breaking— a route removed, a guard lost, a request field now requiredfail-onby severity or category: security, contract, route misses, architecture (your own rules too), performance, dead code- GitLab CI: the same findings in the merge request’s Code Quality widget and test report
- Installs the CLI from npm inside the Action, every parser included — nothing to set up
# .github/workflows/clarifydoc.yml
on: pull_request
permissions:
  contents: read
  pull-requests: write   # the comment
  security-events: write # code scanning
jobs:
  clarifydoc:
    runs-on: ubuntu-latest
    steps:
      - uses: actions/checkout@v4
      - uses: clarifydoc/cli@main
        with:
          fail-on: security,error
          fail-on-api: breaking
FLOW BASELINES
Commit what every endpoint does — and know when it changes
clarifydoc seq draws a route as a sequence diagram: the calls it makes in order, with the
loops and branches read from each function’s control flow, the data it touches and the HTTP hops to
other services. --lock writes every route’s flow to a file you commit; --check
fails the build and says which steps were added, removed or moved. A refactor that was meant to change
nothing can prove it.
- Static: no test run, no recording agent, no environment to stand up
seq --diffshows how one flow changed against the base of a branch- In VS Code, a route’s CodeLens opens the same diagram
# once, on main
clarifydoc seq . --lock flows.json

# in CI, on every branch
clarifydoc seq . --check flows.json
POST /api/orders: 2 changes in the flow
  + PaymentService.capture (now called
      from OrderService.create)
  ~ Orders INSERT moved: from OrderService.create
      to OrderService.create → OrderRepository.save
# exit 1
IN THE REPORT
The tabs you’ll live in
Real screenshots of ClarifyDoc’s report on RealWorld’s open-source Conduit app. Each one opens that tab in the product tour.
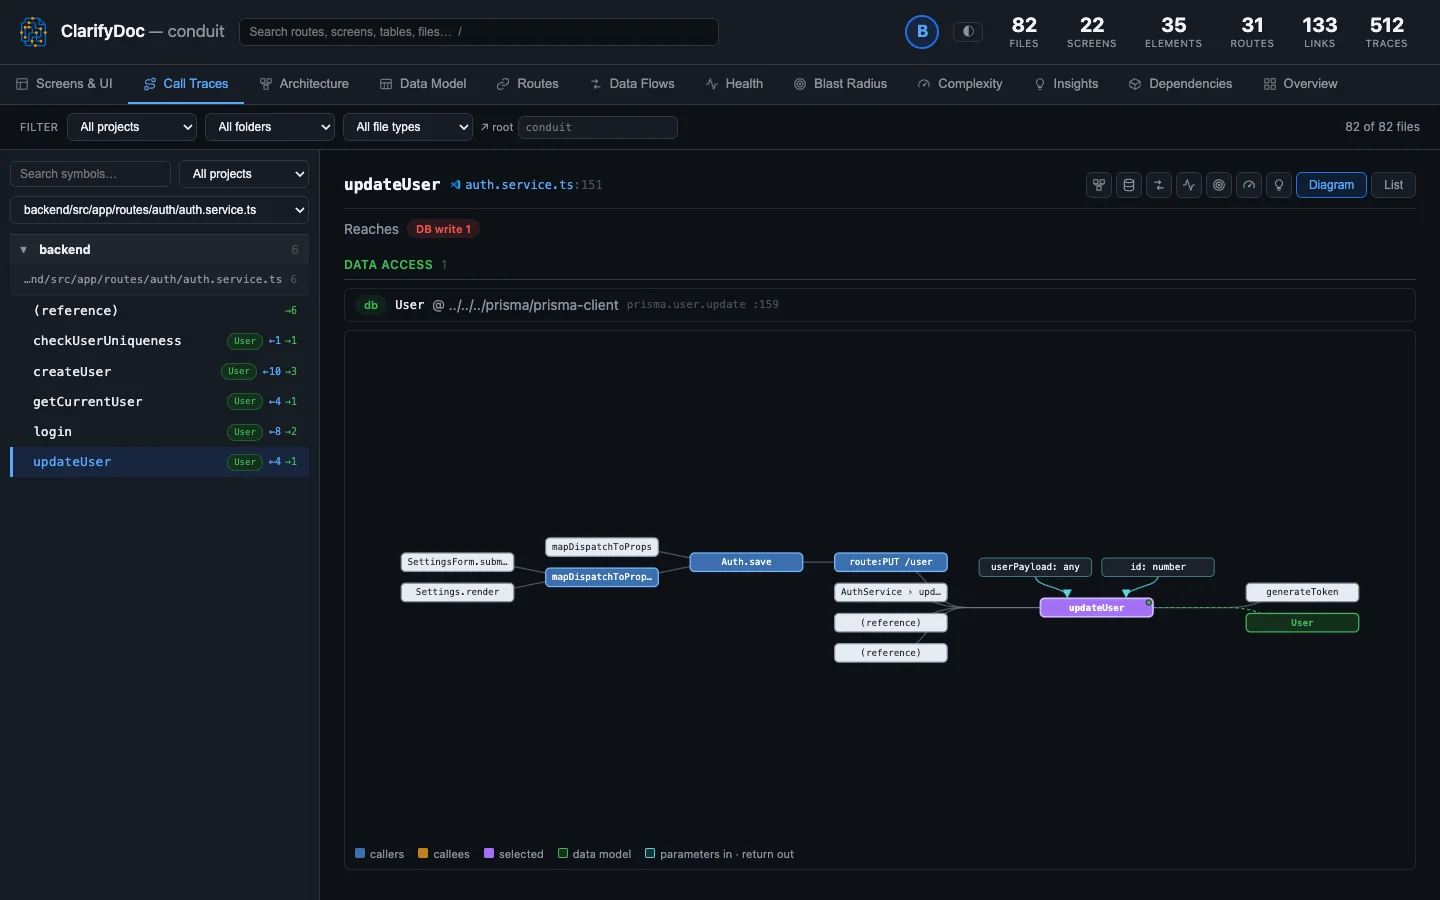 Call Traces
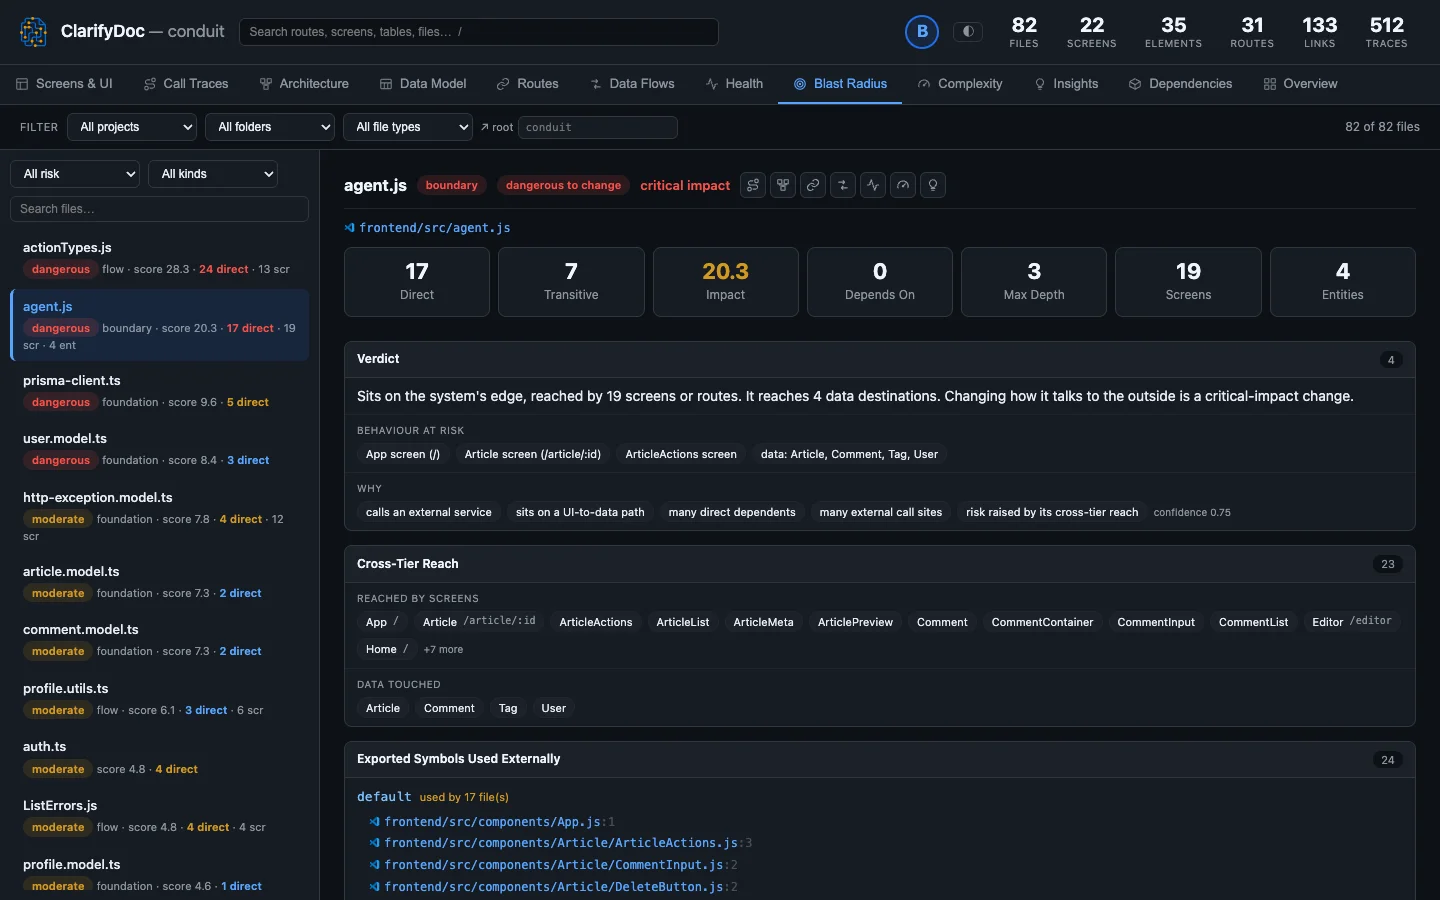 Blast Radius
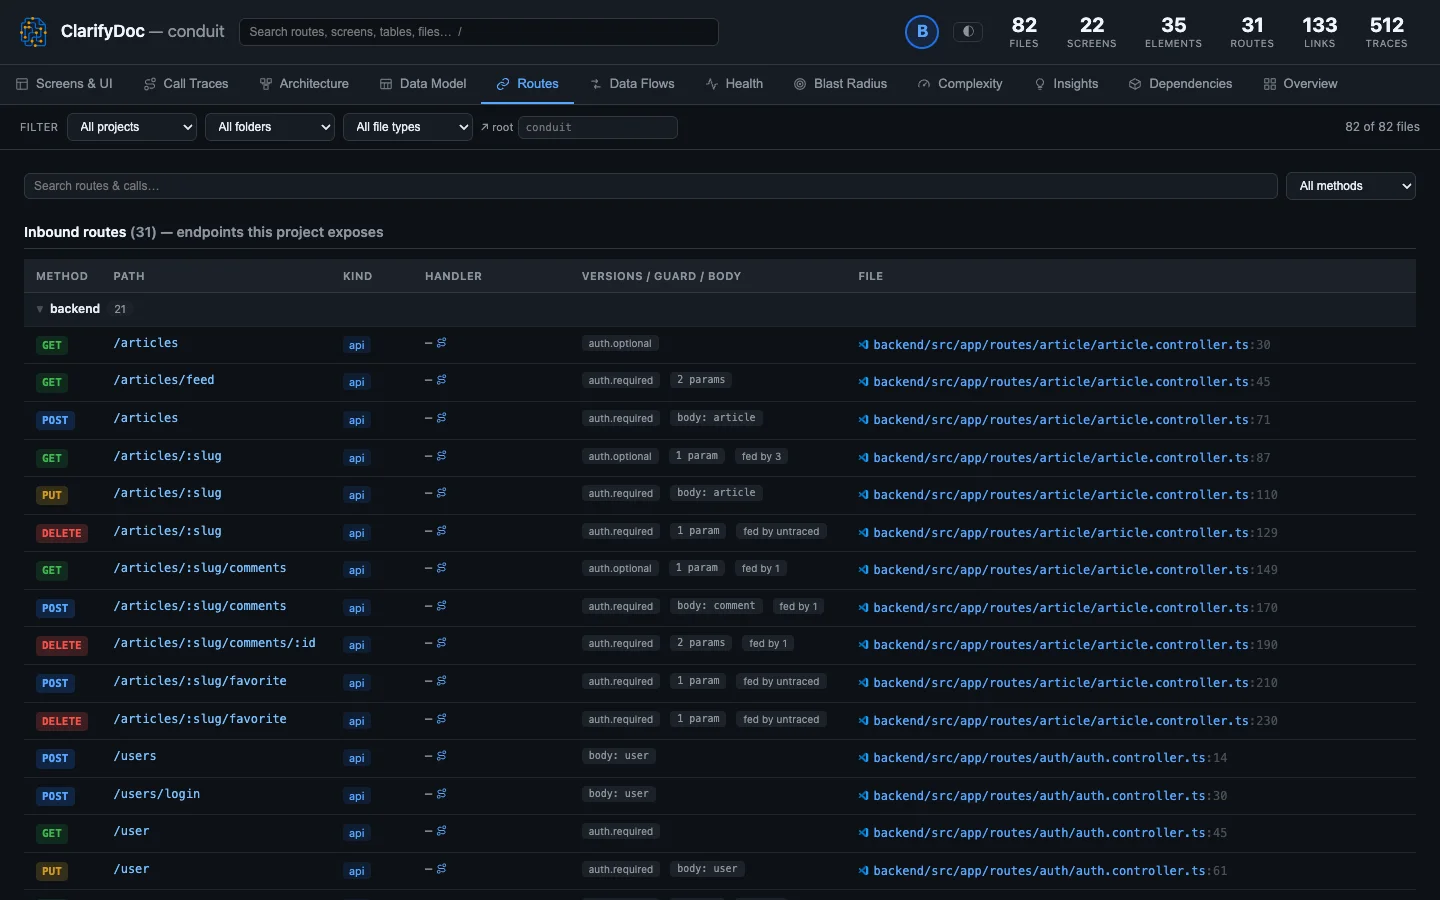 Routes
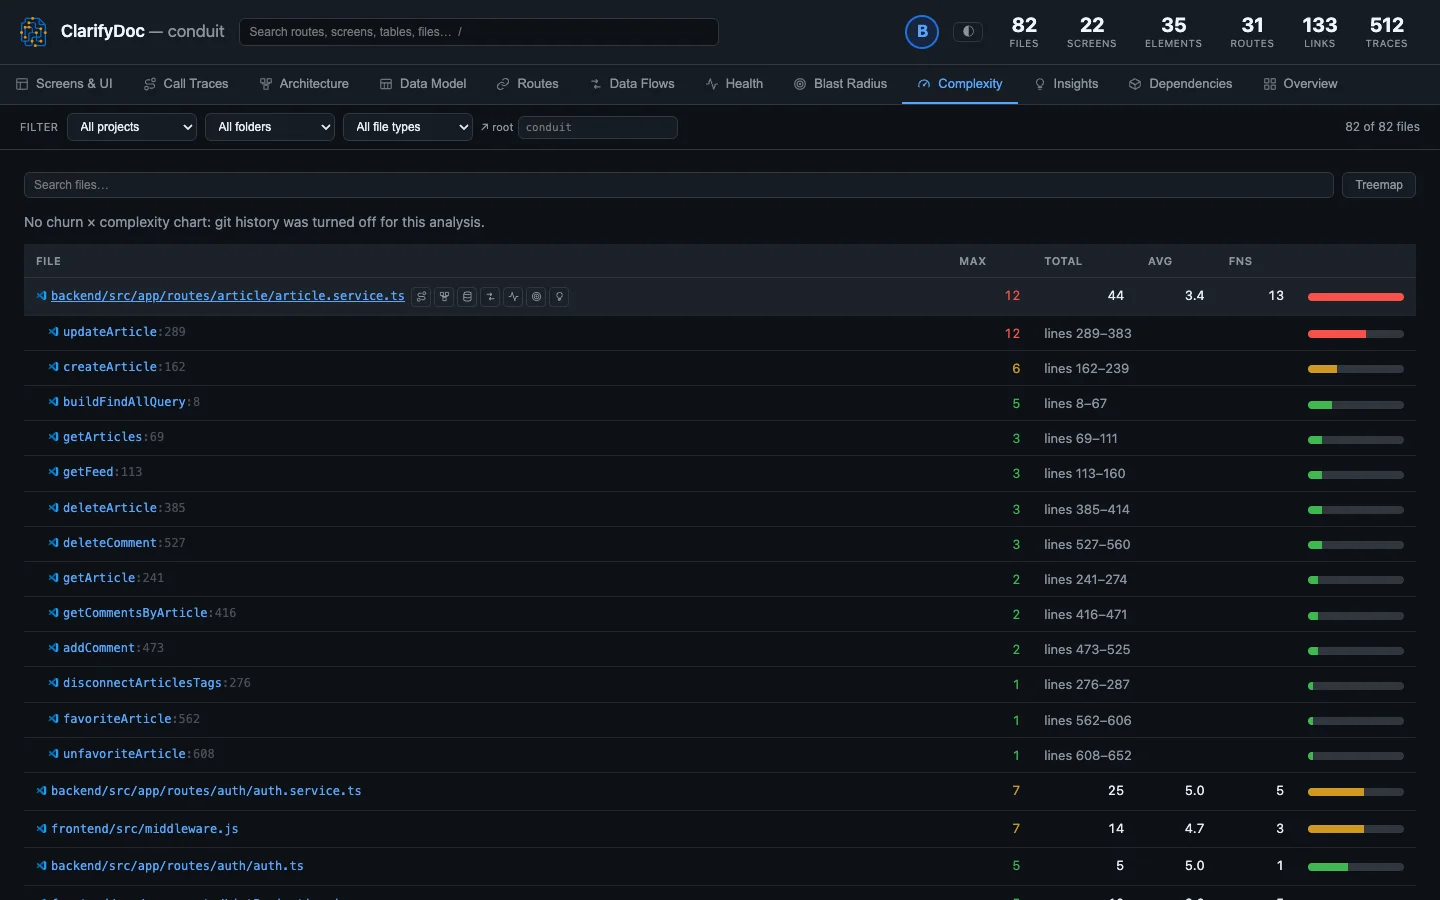 Complexity
Works on the stack you actually have
A Delphi client next to a .NET service next to a React frontend is analyzed as one graph, so frontend → backend → DB links survive across languages and repos. 50+ languages, plus the templates, schemas and contracts around them.
WHERE YOU’LL USE IT
In your editor, your browser and your agent
No account, no upload, no daemon. The same analysis shows up wherever you’re reading code.
In VS Code
CodeLens above every function with its callers, callees and complexity. Hover cards, findings in the Problems panel, and a click on a complexity score draws the function as a flowchart. The Impact view sits in Source Control; right-click any file to open its screens, traces or blast radius.
In the report
Twelve tabs, from screens to dependencies, beside your code or in any browser. It’s one self-contained file, so a reviewer can open it without installing anything. Take the tour →
In your AI agent
Copilot’s agent mode finds it on its own; one command sets up Claude Code, Cursor, Windsurf, Codex, Gemini CLI or Claude Desktop, with skills and hooks for Claude Code. Answers come back with path:line references. The MCP server →
Prefer the terminal? clarifydoc analyze ./my-app --html writes the same report.
Your code stays on your machine
The whole extraction pipeline is static analysis — nothing is uploaded and nothing is sent to a model. Deeper call resolution goes through the language servers already in your editor — no Docker. It's MIT-licensed, so you can read every extractor yourself.
- Runs 100% locally — no account, no telemetry, source never modified
- Deterministic and reproducible, versioned by SHA-256
- One self-contained
report.htmlyou can hand to anyone - Analyze on save keeps the map current as you code