
What is a code visualiser?
A code visualiser — or code visualizer, in American spelling — turns source code into diagrams, so you can see how a system fits together without reading every file. The useful ones answer a question: who calls this?, what breaks if I change it?, which table does this button write? The rest draw a hairball of file imports that looks impressive and answers nothing.
- Import graphs show which file mentions which — not what runs when someone clicks
- Single-language call graphs stop at the HTTP call, where the interesting part begins
- Hand-drawn diagrams are out of date the week after they are drawn
- AI-drawn diagrams change every time you ask, and you can’t check where a box came from
ClarifyDoc draws from a static analysis of the whole workspace. Calls are joined to the routes that answer them and the tables those routes read and write — across languages, repos and dependency injection — and every box and edge points back at a file and line.
WHAT IT DRAWS
Every diagram you’d draw by hand, generated from the code
One analysis, many views. The product tour shows each one on the report of an open-source app, and the live examples let you click through them before you install anything.
Call graph
Any function as a double tree — callers on the left, callees on the right — through interfaces and dependency injection, across the HTTP boundary, down to the tables it touches. Call Traces →
Architecture & C4 diagrams
Context, deployment, projects, components and files — five levels rolled up from the real link graph and laid out the same way every run. Architecture →
ER diagram
The data model recovered from ORM code, SQL and migrations, with every function that reads or writes each entity. Data Model →
Data-flow diagram
Screens to endpoints to tables: which entry points end up writing which data, and through which calls. Data Flows →
Sequence diagrams
A route’s CodeLens draws what it does, in order: the calls it makes, the data it touches and the hops to other services.
Control-flow flowcharts
Click a function’s complexity lens to see it drawn as a flowchart. Click a node to jump to its line.
Dependency graph & coupling
Folder and module dependencies, a coupling matrix, import cycles, named communities and the files everything leans on. Insights →
Blast radius
What a change to a file reaches — dependents, screens, routes and tables — drawn before you make it. Blast Radius →
Screens and their components
Every page with its route, the elements on it, the components it uses and the handler each click runs. Screens & UI →
IN THE EDITOR
Visualise the code you’re reading, where you’re reading it
You don’t have to leave VS Code. The ClarifyDoc sidebar draws the open file’s neighbourhood and redraws it as you switch files; CodeLens and the right-click menu open every other view on the code under the cursor.
- Neighbourhood: the file’s functions, the calls between them, what calls in and what they call out to
- Show in a Graph: the files you select, with their calls and the routes they serve or call
- Show Control Flow: the function under the cursor as a flowchart
- Show a Route as a Sequence Diagram: what one endpoint does, step by step
- Create Architecture Diagram: the whole system, saved as Mermaid, Markdown or SVG
// Command palette — ⇧⌘P / Ctrl+Shift+P
ClarifyDoc: Analyze Workspace
ClarifyDoc: Open Report
ClarifyDoc: Show in a Graph
ClarifyDoc: Show Control Flow
ClarifyDoc: Show a Route as a Sequence Diagram
ClarifyDoc: Create Architecture Diagram
ClarifyDoc: Call Traces for This File
ClarifyDoc: Blast Radius for This File
IN THE REPORT
What the diagrams look like
Real screenshots of ClarifyDoc’s report on RealWorld’s open-source Conduit app. Each one opens that view in the product tour.
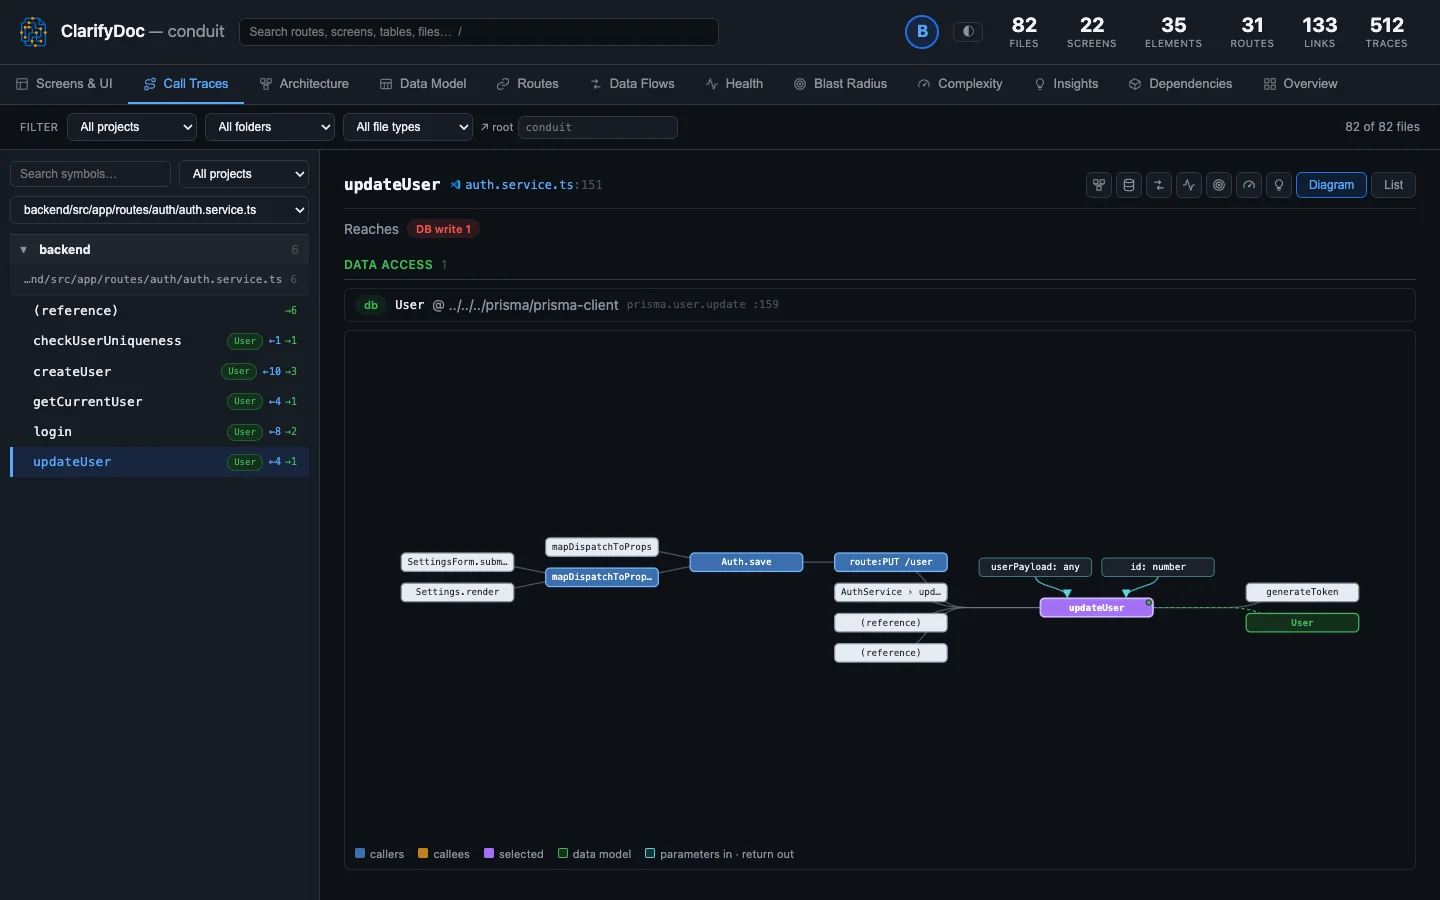 Call graph
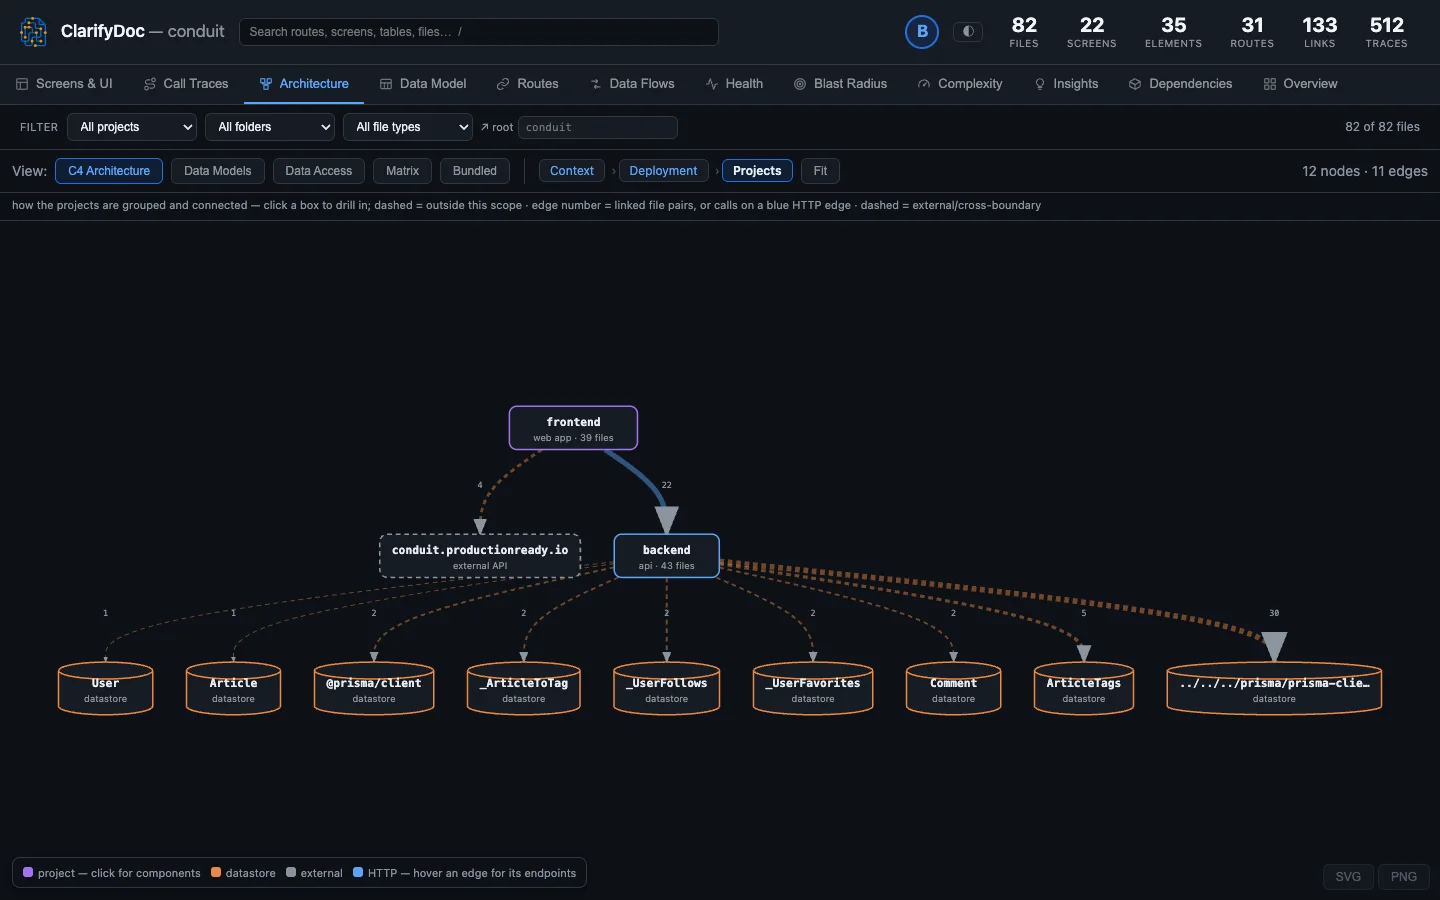 Architecture
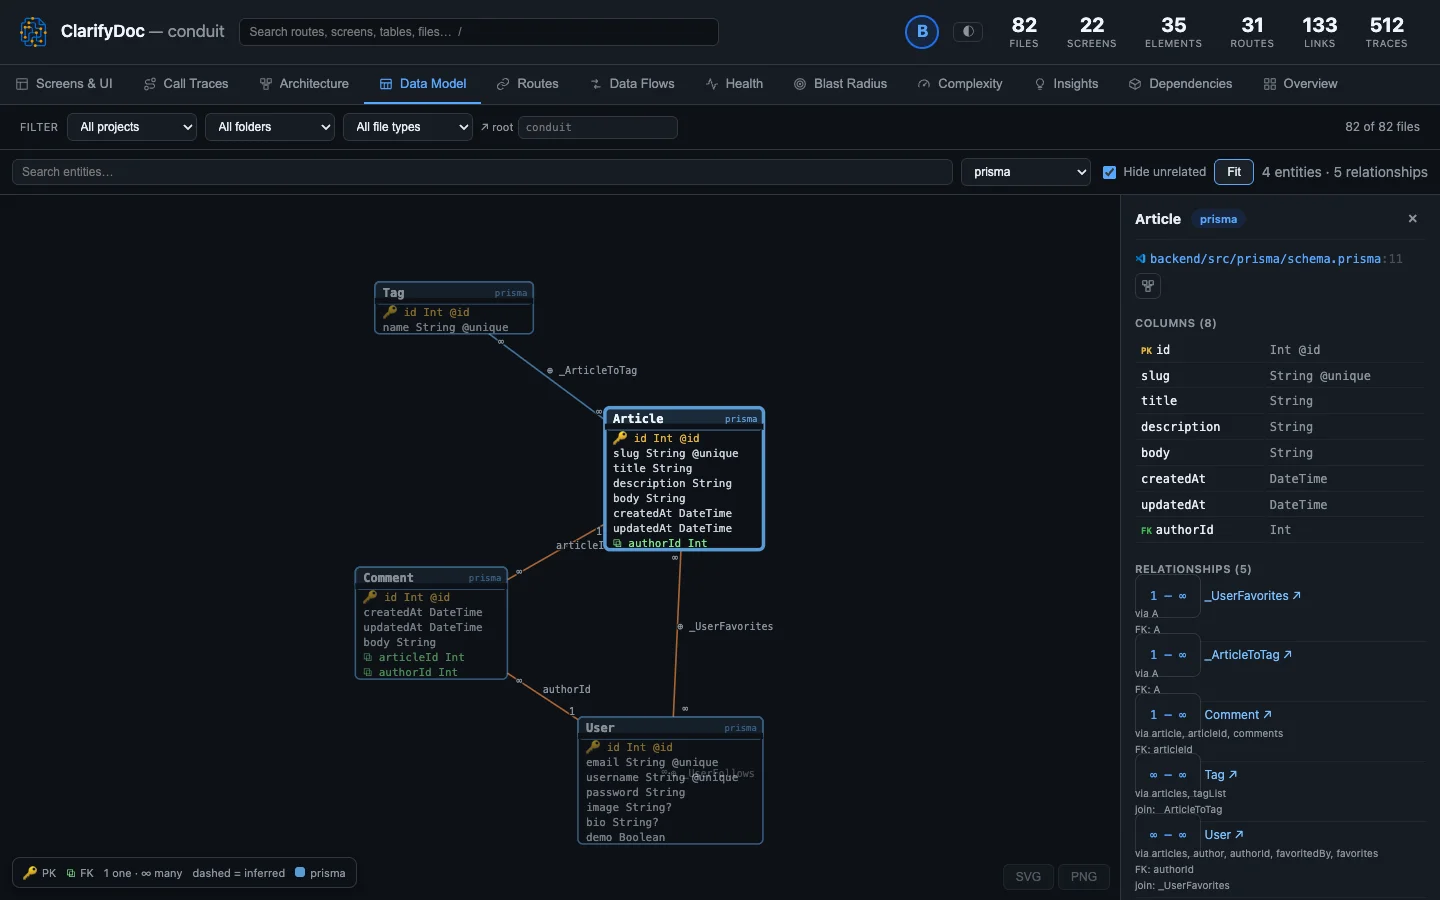 ER diagram
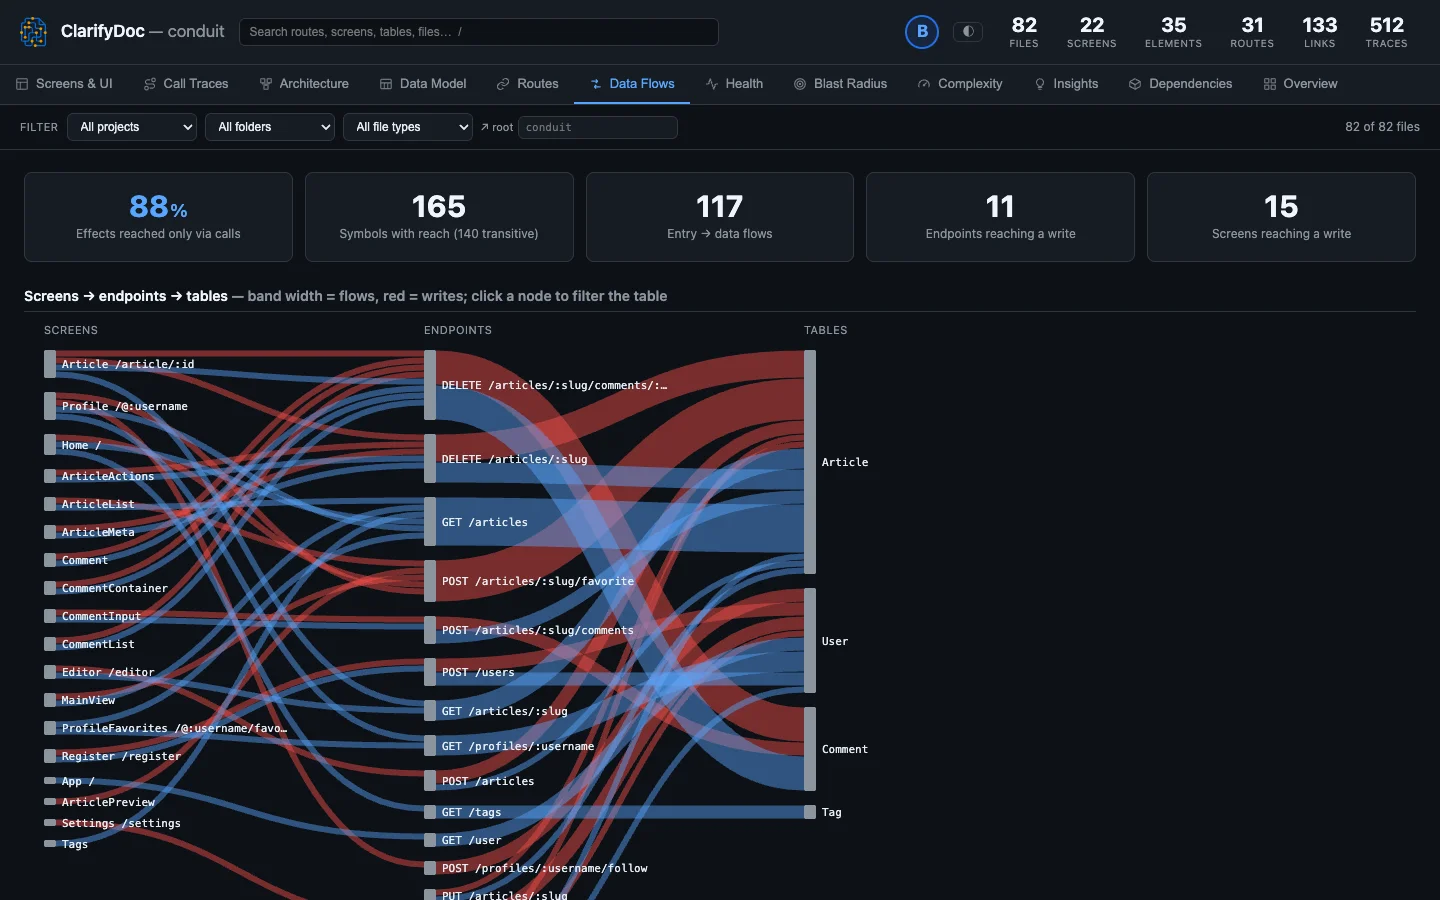 Data flows
Diagrams you can check — and commit
A diagram is only useful if you can trust it. ClarifyDoc’s are built to be checked.
Same code, same diagram
No model and no prompt: the diagram comes from parsing the code, so a commit always draws the same picture and a diff of two diagrams is a diff of the code.
Every edge has a source
Each link says whether it was extracted, inferred or ambiguous, and points at a file and line. Click a box and the source opens beside it.
Measured, not promised
Frontend calls are joined to backend routes with 0.993 precision and 0.966 recall, scored against labels written by hand on real repositories.
Stays current
Re-runs only re-read files whose content changed, so the picture keeps up as you edit — in VS Code on save, or in CI on every pull request.
Exports that travel
Mermaid, Markdown and SVG to commit beside the code; GraphML for Gephi and Cypher for Neo4j; the full report as one self-contained HTML file.
Your code stays yours
Runs 100% locally — no upload, no account, no telemetry. Open source under the MIT license.
Visualise any codebase — modern or legacy
50+ languages in one picture: a React frontend, a .NET service and a Delphi client become one graph. TypeScript, JavaScript, Java, Kotlin, C#, Python, Go, Rust, PHP, Ruby, Swift, Dart, C and C++ — and Delphi, VB6, Fortran and PowerShell — along with SQL, OpenAPI, GraphQL, Protocol Buffers, Docker Compose, Kubernetes and Terraform. See the full list →
QUESTIONS
Code visualiser FAQ
What is a code visualiser?
A code visualiser (or code visualizer) turns source code into diagrams — call graphs, dependency graphs, architecture and data-model diagrams — so you can see how a system is put together without reading every file. ClarifyDoc draws them from a static analysis of the code, so they match the code you have today.
Does ClarifyDoc upload my code or use AI to draw the diagrams?
No. It runs on your machine, in your editor or in CI, with no account and no telemetry. The diagrams come from parsing the code, not from a language model, so the same commit always gives the same diagram.
Which languages can it visualise?
More than 50, mixed freely in one workspace: TypeScript, JavaScript, Java, Kotlin, C#, Python, Go, Rust, PHP, Ruby, Swift, Dart, C and C++, and legacy languages such as Delphi, VB6, Fortran and PowerShell, along with SQL, OpenAPI, GraphQL and deployment files.
Can I export the diagrams?
Yes. Create Architecture Diagram saves the system as Mermaid, Markdown or SVG to commit beside the code, and the command line exports Mermaid, GraphML and Cypher. The full report is one self-contained HTML file you can send to anyone.
How is it different from a call-graph or dependency-graph extension?
Most code visualisers draw the imports between files, or the calls inside one language. ClarifyDoc follows the calls across the HTTP boundary and through dependency injection, so one diagram goes from the screen a user clicks, through the API route that answers it, to the database table it writes.
Is it free?
Yes. The VS Code extension is free, and the analyzer is open source under the MIT license.
TRY IT
See your own code in a minute
Install the extension and run ClarifyDoc: Analyze Workspace. The report opens beside your code — no Node.js install, no Docker, no configuration.
code --install-extension ClarifyDoc.clarifydoc-vscode